How to Calculate a Z-Score in Excel How to Use the Excel STANDARDIZE Function
FBTwitterReddit
video description
Rating: 4.0; Vote: 1
we will teach you how to calculate a Z-Score using Microsoft Excel.
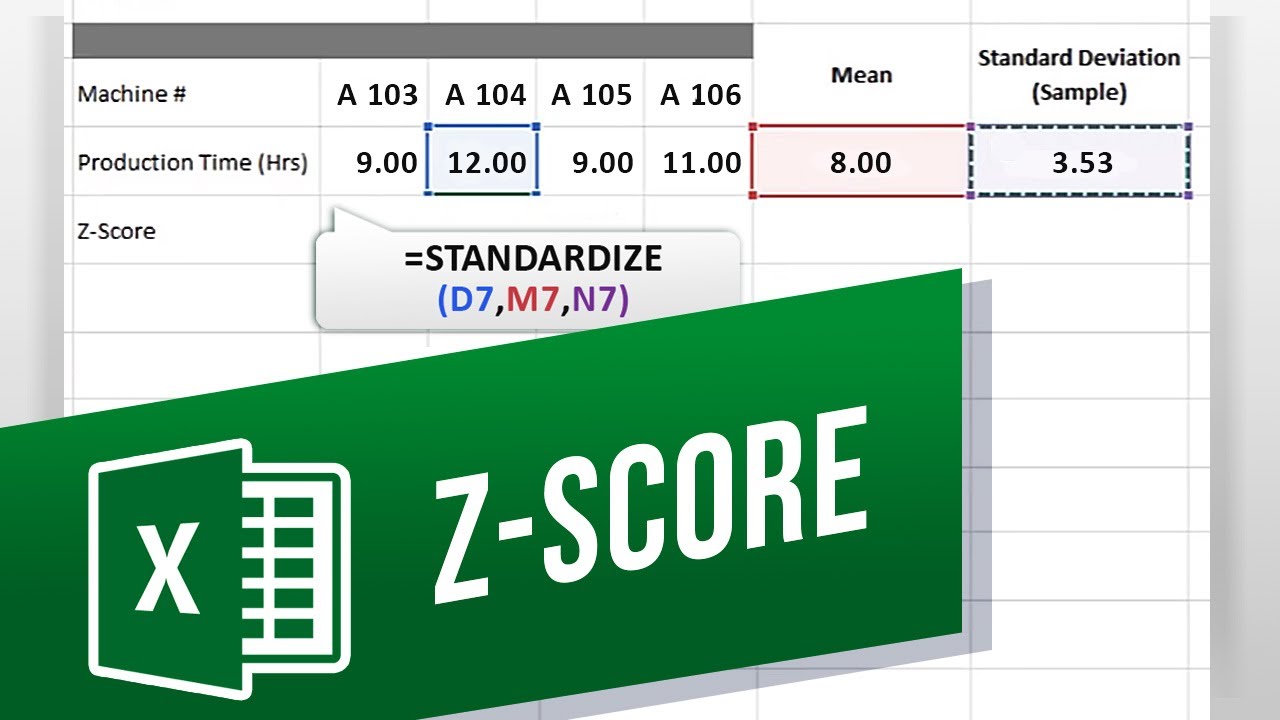
A Z-Score measures exactly how many standard deviations above or below the mean of a data point is. Over here, we have the data set for 13 machines and the total duration for which each of those machines were used for production during the day. Now lets say we want to calculate the Z score for each of these machines.
Over here, we have already calculated the mean and standard deviation of the sample and we would be using these two values to calculate the Z-Score.
Links are in the description if you want to learn how to calculate standard deviation of a data set.
The formula for calculating the Z-Score is subtracting the mean from the data point and dividing it by standard deviation. So for this tutorial, the total duration of each machine used for production will be the individual data point.
So lets move to a new cell, type in equals to followed by open brackets and select the data point here. Next lets subtract the value from the mean and close the bracket. After that, lets divide it by the standard deviation.
Once we hit enter, you can see here that the Z-score of the data point which is roughly 0. 28 standard deviation above the mean, because this is a positive value here.
Alternatively, you can simply use the Standardize formula to calculate the Z-Score. For that, lets move to a new cell and type in equals to. After that, lets enter Standardize and open bracket. Here you can see that excel is asking for the data point, so lets select the cell here. After that we will add a comma and select the mean value. With that done, lets add another comma and select the standard deviation value.
Once we hit enter, excel will calculate the Z-Score for the data point selected Date: 2023-07-08