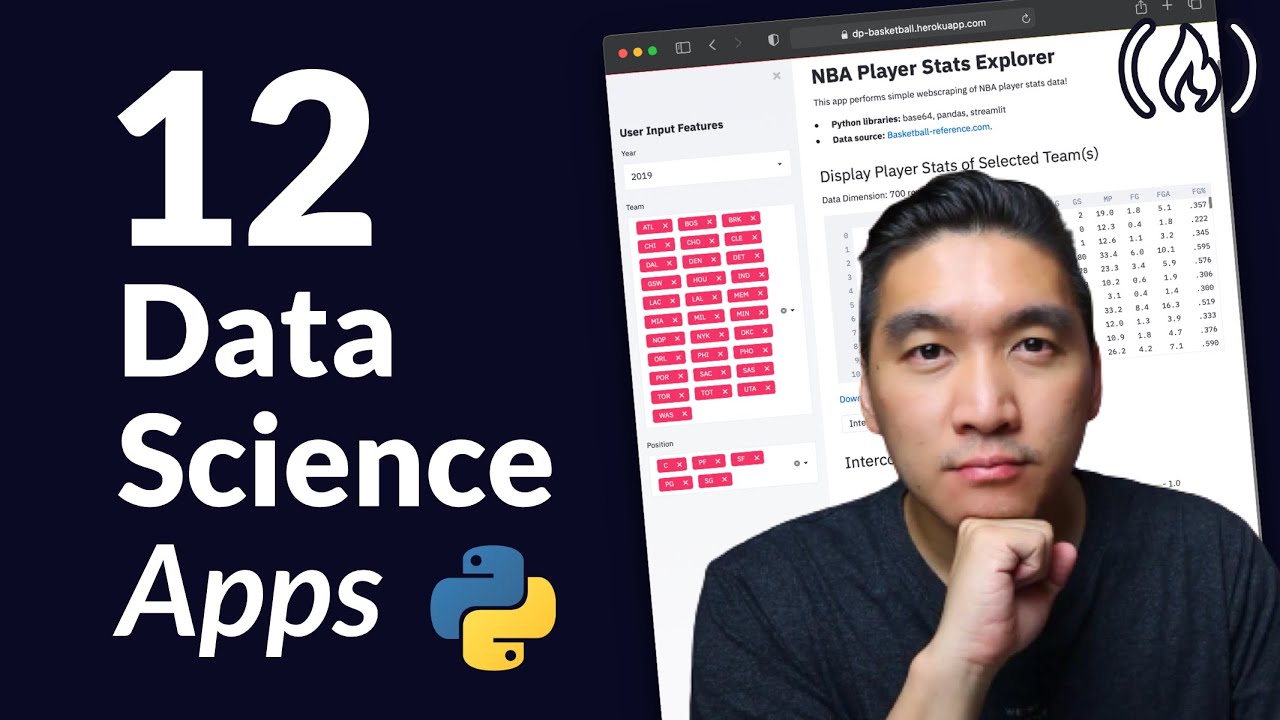
Build 12 Data Science Apps with Python and Streamlit - Full Course
video description
Date: 2022-03-14
Related videos


Comments and reviews: 10
Lynette
The market is very unstable and you can not tell If it's going bearish or bullish. I advise y'all to forget predictions and start making a good profit now because future valuations are all speculations and guesses.When these reports are bullish take some off to the side lines, when news gets bearish start buying. -Keep it simple simple- that bear/ correction was the best thing that happened me.
reply
The market is very unstable and you can not tell If it's going bearish or bullish. I advise y'all to forget predictions and start making a good profit now because future valuations are all speculations and guesses.When these reports are bullish take some off to the side lines, when news gets bearish start buying. -Keep it simple simple- that bear/ correction was the best thing that happened me.
reply
Al
I have modify the EDA SMP500 Stock Price plots with plotly Express I think is better adapt for Streamlit , what do you think ?
def price_plot(symbol):-
df = pd.DataFrame(data[symbol].Close)-
df['Date'] = df.index-
fig = px.line(df.Date, y= df.Close)-
fig.update_layout(title= symbol,-
xaxis_title='Date',-
yaxis_title='Price ($)')-
st.write(fig)
reply
I have modify the EDA SMP500 Stock Price plots with plotly Express I think is better adapt for Streamlit , what do you think ?
def price_plot(symbol):-
df = pd.DataFrame(data[symbol].Close)-
df['Date'] = df.index-
fig = px.line(df.Date, y= df.Close)-
fig.update_layout(title= symbol,-
xaxis_title='Date',-
yaxis_title='Price ($)')-
st.write(fig)
reply
Crypto
Great tutorial! thanks a lot for everything!
I encounter a small bug however when trying to filter the data on the EDA apps as the number of rows, columns don't update, and neither does the information when trying to select a different year.
Does anyone have any ideas what should I do to fix it?
reply
Great tutorial! thanks a lot for everything!
I encounter a small bug however when trying to filter the data on the EDA apps as the number of rows, columns don't update, and neither does the information when trying to select a different year.
Does anyone have any ideas what should I do to fix it?
reply
Thiago
I have a doubt/issue in the app 5:
Please, how to solve it?
Most sites teach how to ignore/bypass but I would like to learn how to solve it.
Thanks for the simplicity and for doing meaningful apps straight away, that's what I was looking for.
reply
I have a doubt/issue in the app 5:
Please, how to solve it?
Most sites teach how to ignore/bypass but I would like to learn how to solve it.
Thanks for the simplicity and for doing meaningful apps straight away, that's what I was looking for.
reply
ashwani
StreamlitAPIException: (-Expected bytes, got a 'int' object-, 'Conversion failed for column FG% with type object')
36:00 not working showing error like this
reply
StreamlitAPIException: (-Expected bytes, got a 'int' object-, 'Conversion failed for column FG% with type object')
36:00 not working showing error like this
reply
charles
could you do another class: serverless version with react chrome browser local and web asm with chartjs charting and a js datatable with sort and filtering ?
reply
could you do another class: serverless version with react chrome browser local and web asm with chartjs charting and a js datatable with sort and filtering ?
reply
Zhipeng
My question is, the app can be run locally, but when deploying through github. It has problems. Is it caused by the location of the dataset?
reply
My question is, the app can be run locally, but when deploying through github. It has problems. Is it caused by the location of the dataset?
reply
K2ICC
It will be nice one to plot moving averages instead of the Bollinger Bands. For example, to plot the 20, 50 and 200 ma on the same chart.
reply
It will be nice one to plot moving averages instead of the Bollinger Bands. For example, to plot the 20, 50 and 200 ma on the same chart.
reply
CharitosYannis
Thank you sir for sharing. best 3 hours of my recent data science journey.
Thank you again. i need more content like this
reply
Thank you sir for sharing. best 3 hours of my recent data science journey.
Thank you again. i need more content like this
reply
Metal
right away i get the feeling that you lay things out in a genius fashion this is great and focused upon efficiency and simplification
reply
right away i get the feeling that you lay things out in a genius fashion this is great and focused upon efficiency and simplification
reply
Add a review, comment
Other channel videos