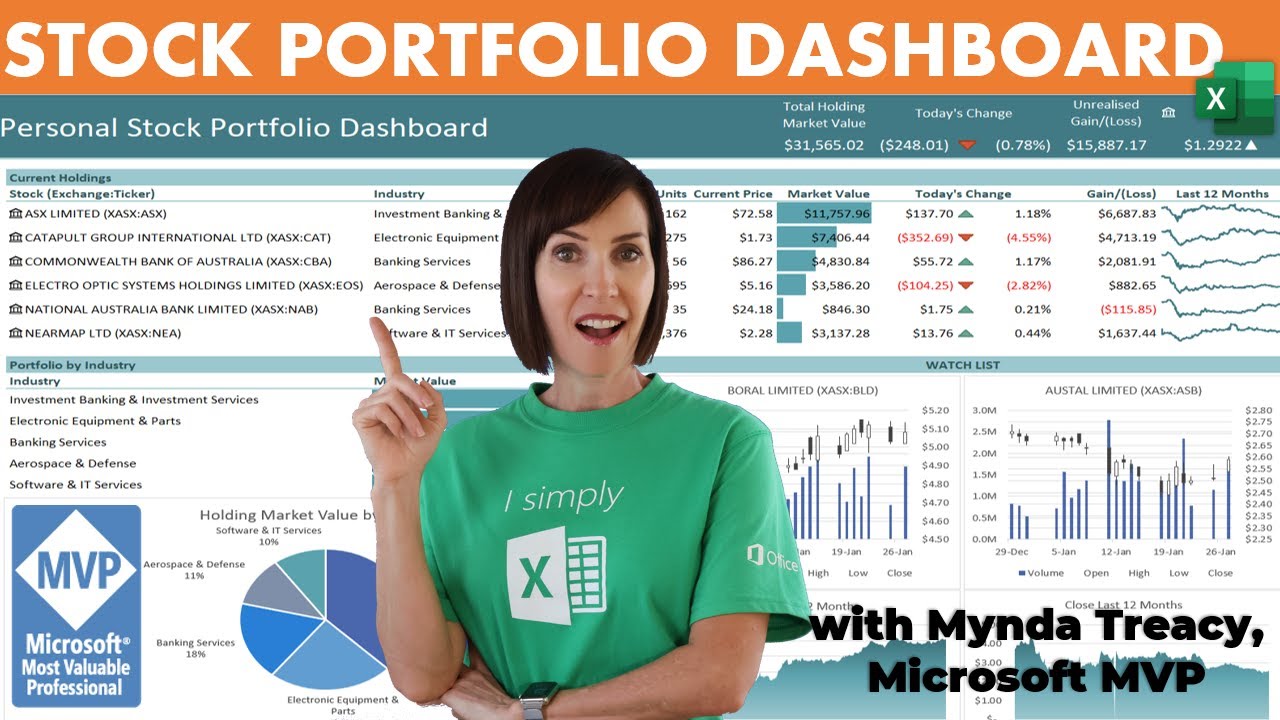
Excel Stock Portfolio Dashboard - FREE File Download - My Online Training Hub
video description
Date: 2022-04-08
Related videos




Comments and reviews: 10
Bruce
Hello, really enjoyed this tutorial and used to duplicate a portfolio dashboard. I have one question regarding linking to cells in a table? For example if I use your ledger sheet as a base for other sheets (say a household list of equities shared by my wife and I) and I create other smaller sheets from it (mine & my wife's) linking a few equities from master to individual, like name, last price or say target price, things work great until I use the sort feature in the table say sort by name or sort by total gain the linked cells in the other sheet linked by (=Equities!F6) will not follow the sort, it simply displays the contents of the newly sorted =Equities!F6. How do I tell this link to follow the content of the cell if sorted in table on other sheet?
reply
Hello, really enjoyed this tutorial and used to duplicate a portfolio dashboard. I have one question regarding linking to cells in a table? For example if I use your ledger sheet as a base for other sheets (say a household list of equities shared by my wife and I) and I create other smaller sheets from it (mine & my wife's) linking a few equities from master to individual, like name, last price or say target price, things work great until I use the sort feature in the table say sort by name or sort by total gain the linked cells in the other sheet linked by (=Equities!F6) will not follow the sort, it simply displays the contents of the newly sorted =Equities!F6. How do I tell this link to follow the content of the cell if sorted in table on other sheet?
reply
Tom-s
Great video, it's been very helpful for producing my personal portfolio dashboard. My question is, what if stock currencies are not always the same? My portfolio includes USD and EUR, and I can't find a way to transform -Current Price- column (E) from EUR to USD (if applies depending on stock) in order to have all values in the same currency, USD in my case as it's the international standard. Since -Current Price- column data comes from Stock data, value is always given in original stock currency and not transformed to the -common- currency in the spreadsheet. Same would happen to yours if you added a line in your Ledger in USD instead of AUD (being AUD the -common- currency).
Thanks!!
reply
Great video, it's been very helpful for producing my personal portfolio dashboard. My question is, what if stock currencies are not always the same? My portfolio includes USD and EUR, and I can't find a way to transform -Current Price- column (E) from EUR to USD (if applies depending on stock) in order to have all values in the same currency, USD in my case as it's the international standard. Since -Current Price- column data comes from Stock data, value is always given in original stock currency and not transformed to the -common- currency in the spreadsheet. Same would happen to yours if you added a line in your Ledger in USD instead of AUD (being AUD the -common- currency).
Thanks!!
reply
GTR-1000
Hi - Great informative video and spreadsheet. Just have a question and hopefully you can provide a fix. I have Australia Stock 'Vanguard MSCI Aust SmCosIdxETF (XASX:VSO)' which in your spreadsheet generates an Industry result as #FIELD! To make life easy, is it possible to return an Industry of say -Other- so the Holding Chart by Industry will work and show values (or %) of stocks held outside the normal Industry categories? I hope this makes sense and you have a simple formula to fix this. Cheers
reply
Hi - Great informative video and spreadsheet. Just have a question and hopefully you can provide a fix. I have Australia Stock 'Vanguard MSCI Aust SmCosIdxETF (XASX:VSO)' which in your spreadsheet generates an Industry result as #FIELD! To make life easy, is it possible to return an Industry of say -Other- so the Holding Chart by Industry will work and show values (or %) of stocks held outside the normal Industry categories? I hope this makes sense and you have a simple formula to fix this. Cheers
reply
Jim
Mynda, I downloaded and opened your file, but keep running into an error: -Excel ran out of resources while attempting to calculate one or more formulas. As a result, these formulas cannot be evaluated- This freezes the file.
When I check my resources, (in Task Manager) there appears to be no problem - and there shouldn't be as I have a newer, Ryzen - based system with 16GB of memory).
Can you shed any light on this, or am I having a unique problem?
Thanks
reply
Mynda, I downloaded and opened your file, but keep running into an error: -Excel ran out of resources while attempting to calculate one or more formulas. As a result, these formulas cannot be evaluated- This freezes the file.
When I check my resources, (in Task Manager) there appears to be no problem - and there shouldn't be as I have a newer, Ryzen - based system with 16GB of memory).
Can you shed any light on this, or am I having a unique problem?
Thanks
reply
Shimpanzen
Thank you for this helpful video. I realized that, if there was a split of shares, the stockhistory shows a loss. E.g. value of share is 100 and the split rate is 20 the share value has to be 5, obviously. the problem is, stockhistory does not adjust the past values. so it shows at day 0 the value of 100 and after the split on day 1 the value of 5. so the graph drops dramatically and it looks like a loss of value of 95. I hope I could visualize my problem.
reply
Thank you for this helpful video. I realized that, if there was a split of shares, the stockhistory shows a loss. E.g. value of share is 100 and the split rate is 20 the share value has to be 5, obviously. the problem is, stockhistory does not adjust the past values. so it shows at day 0 the value of 100 and after the split on day 1 the value of 5. so the graph drops dramatically and it looks like a loss of value of 95. I hope I could visualize my problem.
reply
io
Just stumbled across this. Excellent video. However, Microsoft in all of their wisdom had provided end-of-day stock quotes in previous versions of Excel and then removed the functionality for a couple of versions. That leads to the question of developing a dashboard dependent on MS retaining this capability and not removing it again sometime in the future (once burned, twice wary). Also, I avoid subscription software like the plague.
reply
Just stumbled across this. Excellent video. However, Microsoft in all of their wisdom had provided end-of-day stock quotes in previous versions of Excel and then removed the functionality for a couple of versions. That leads to the question of developing a dashboard dependent on MS retaining this capability and not removing it again sometime in the future (once burned, twice wary). Also, I avoid subscription software like the plague.
reply
ninob
A huge thanks from south korea! Although it seems the video has been uploaded for more than a year, I've started learning excel lately and found this recently. Its true there are a lot of helpful contents in the internet but by far this video was one of the most helpful one applying my purpose for learning. Thanks again. I am very excited to further study with your tutorials!
reply
A huge thanks from south korea! Although it seems the video has been uploaded for more than a year, I've started learning excel lately and found this recently. Its true there are a lot of helpful contents in the internet but by far this video was one of the most helpful one applying my purpose for learning. Thanks again. I am very excited to further study with your tutorials!
reply
Michael
Thank you for the tutorial, I have found that for some reason having followed the steps that I recently found an error message that stated the following -Excel ran out of resources while attempting to calculate one or more formulas. As a result, these formulas cannot be evaluated-. What does this mean?
reply
Thank you for the tutorial, I have found that for some reason having followed the steps that I recently found an error message that stated the following -Excel ran out of resources while attempting to calculate one or more formulas. As a result, these formulas cannot be evaluated-. What does this mean?
reply
Jarod
This is an amazing video!!! However, I am struggling with the B6 function. I have copied the function used but my excel does not seem to like it whenever I use 'Ledger[Stock]'. I always receive an error message. Is there a reason for this and possibly a remedy? Any help would be hugely appreciated :-)
reply
This is an amazing video!!! However, I am struggling with the B6 function. I have copied the function used but my excel does not seem to like it whenever I use 'Ledger[Stock]'. I always receive an error message. Is there a reason for this and possibly a remedy? Any help would be hugely appreciated :-)
reply
Gary
My life would be complete if you could make a similar spreadsheet which also tracks Cryptocurrency. I have spent several years at university and wish my lecturers would explain things as clearly as you do! Great video and a wonderful spreadsheet, thank you! :-)
reply
My life would be complete if you could make a similar spreadsheet which also tracks Cryptocurrency. I have spent several years at university and wish my lecturers would explain things as clearly as you do! Great video and a wonderful spreadsheet, thank you! :-)
reply
Add a review, comment
Other channel videos