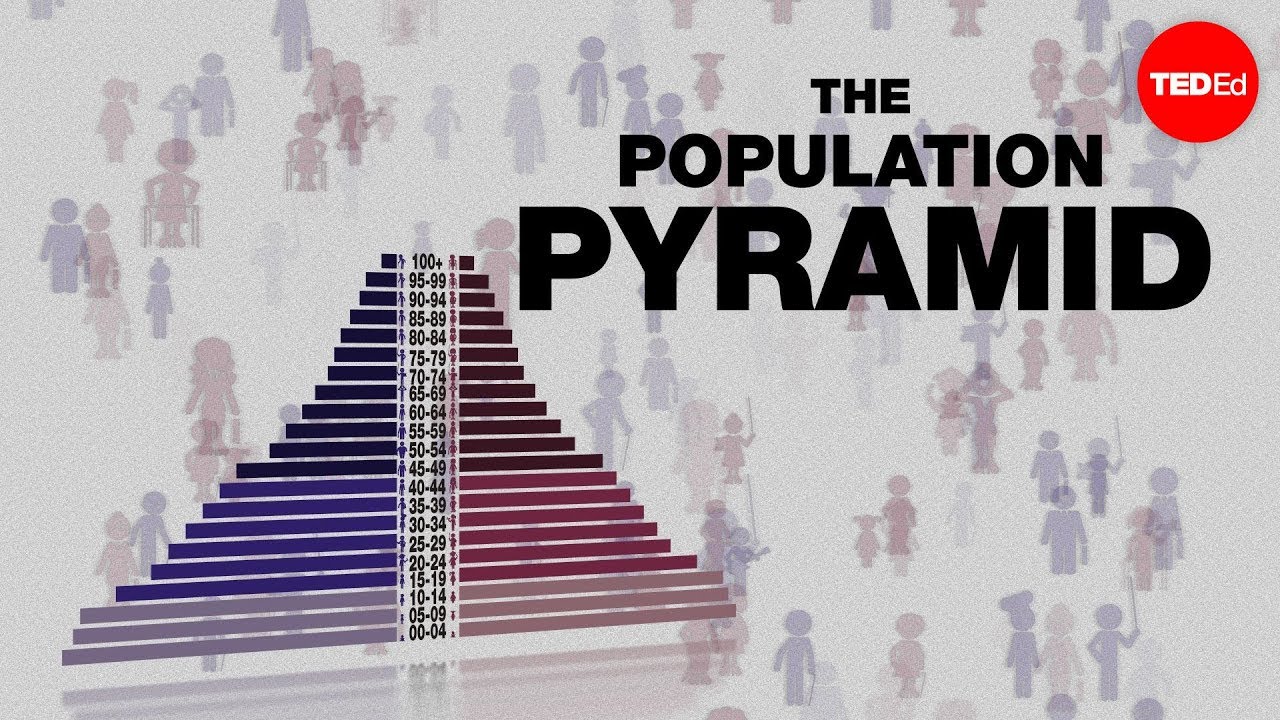
Population pyramids: Powerful predictors of the future - Kim Preshoff
video description
Date: 2020-08-22
Related videos






Comments and reviews: 7
A.
For the world, the population looks like this:
1900: 1. 7 billion
1920: 2. 1 billion
1940: 2. 3 billion
1960: 3. 2 billion
1980: 4. 7 billion
2000: 6. 1 billion
2020: 7. 8 billion
2040: 9. 0 billion
2060: 10. 2 billion
2080: 10. 6 billion
2100: 11. 0 billion
2120: 10. 9 billion
2140: 10. 6 billion
2160: 10. 2 billion
2180: 9. 7 billion
2200: 9. 1 billion
2220: 8. 5 billion
2240: 8. 0 billion
2260: 7. 6 billion
2280: 7. 4 billion
2300: 7. 3 billion
.
.
.
reply
For the world, the population looks like this:
1900: 1. 7 billion
1920: 2. 1 billion
1940: 2. 3 billion
1960: 3. 2 billion
1980: 4. 7 billion
2000: 6. 1 billion
2020: 7. 8 billion
2040: 9. 0 billion
2060: 10. 2 billion
2080: 10. 6 billion
2100: 11. 0 billion
2120: 10. 9 billion
2140: 10. 6 billion
2160: 10. 2 billion
2180: 9. 7 billion
2200: 9. 1 billion
2220: 8. 5 billion
2240: 8. 0 billion
2260: 7. 6 billion
2280: 7. 4 billion
2300: 7. 3 billion
.
.
.
reply
reuben
thank you for the lecture
but i have a problem please help, i dont know how to find suitable scale when being told to plot in such a case your given huge numbers. how do you find the scale of the horizontal? thank you in advance
reply
thank you for the lecture
but i have a problem please help, i dont know how to find suitable scale when being told to plot in such a case your given huge numbers. how do you find the scale of the horizontal? thank you in advance
reply
Berto7x
meanwhile here in Indonesia, it's still common to find urban people having 3 kids, and seems like lower-middle income people have more child on average than the upper class.
reply
meanwhile here in Indonesia, it's still common to find urban people having 3 kids, and seems like lower-middle income people have more child on average than the upper class.
reply
Munia
Sounds interesting
I had to draw some population pyramids for practical exam last year
It was fun. This year i have population geography. I hope I'll enjoy it.
reply
Sounds interesting
I had to draw some population pyramids for practical exam last year
It was fun. This year i have population geography. I hope I'll enjoy it.
reply
education
Look at the home prices of a country when the mean age is around 35, especially major cities. Of course it's depend in each country situation. But just take a look
reply
Look at the home prices of a country when the mean age is around 35, especially major cities. Of course it's depend in each country situation. But just take a look
reply
Vn
In developing or poor, backward countries, the population is pyramid. while in rich and developed countries, the population has an oval shape
reply
In developing or poor, backward countries, the population is pyramid. while in rich and developed countries, the population has an oval shape
reply
Jeff
he says in a few years the population should double nope instead we lose millions of people in a couple of months from a deadly virus
reply
he says in a few years the population should double nope instead we lose millions of people in a couple of months from a deadly virus
reply
Add a review, comment
Other channel videos